May 5, 2024
Demystifying Multi-Cluster Observability: Streamlining Log Collection with Grafana Loki and Promtail
Unveiling the Power of Centralized Logging in Complex Environments



Introduction
In today's complex IT landscape, where distributed systems are the norm, achieving observability is paramount for ensuring smooth operations and optimal performance. At Trhyo, we understand the challenges faced by organizations managing multi-cluster solutions, where disparate Kubernetes clusters operate across different regions, each hosting a variety of services and applications.
Observability, the ability to understand and troubleshoot system behavior through logs, metrics, and traces, becomes increasingly complex as the deployment environment grows. It's crucial to have a centralized platform that provides unified visibility across all clusters, facilitating seamless data analysis and troubleshooting.
Throughout this series of blog posts, we'll explore the intricacies of building a robust observability solution tailored for multi-cluster Kubernetes environments. Our journey begins with a focus on log collection, leveraging the power of Grafana Loki and Promtail to centralize and streamline log management across distributed clusters.
Why Grafana Loki?
Grafana Loki is a horizontally-scalable, highly-available, multi-tenant log aggregation system inspired by Prometheus. It is designed to handle high volumes of logs while keeping operational overhead low. At its core, Loki stores logs as chunks of data in object storage, making it highly efficient and cost-effective.
On the other hand, Promtail is an agent that ships logs from applications to Loki. It tailors logs for Loki ingestion, making them ready for querying and analysis.
Loki can be deployed as a single binary for simple setups, scaled for larger deployments, or deployed as microservices for more complex environments. This flexibility enables organizations to tailor Loki's deployment to their specific needs and infrastructure preferences.

Architecture
In our multi-cluster environment, we envision a scenario where distinct Kubernetes clusters operate across different regions. Each cluster hosts a unique set of services and applications, contributing to the complexity of our distributed system. To achieve a unified view of system behavior and facilitate effective troubleshooting, we adopt a centralized approach to log collection.
Centralizing logs into the Ops cluster offers several benefits:
Unified Visibility: Consolidating logs from all clusters into one location provides a comprehensive view of system-wide activities, simplifying monitoring and analysis.
Simplified Troubleshooting: Teams can focus on a single, consolidated log repository in the Ops cluster, streamlining troubleshooting efforts and reducing mean time to resolution (MTTR).
Cross-Cluster Analysis: Centralized logs facilitate cross-cluster analysis, allowing teams to correlate events and detect issues spanning multiple clusters.
Scalability and Manageability: Managing log collection and storage becomes more manageable when centralized, enhancing scalability and reducing operational overhead.
Architectural Overview
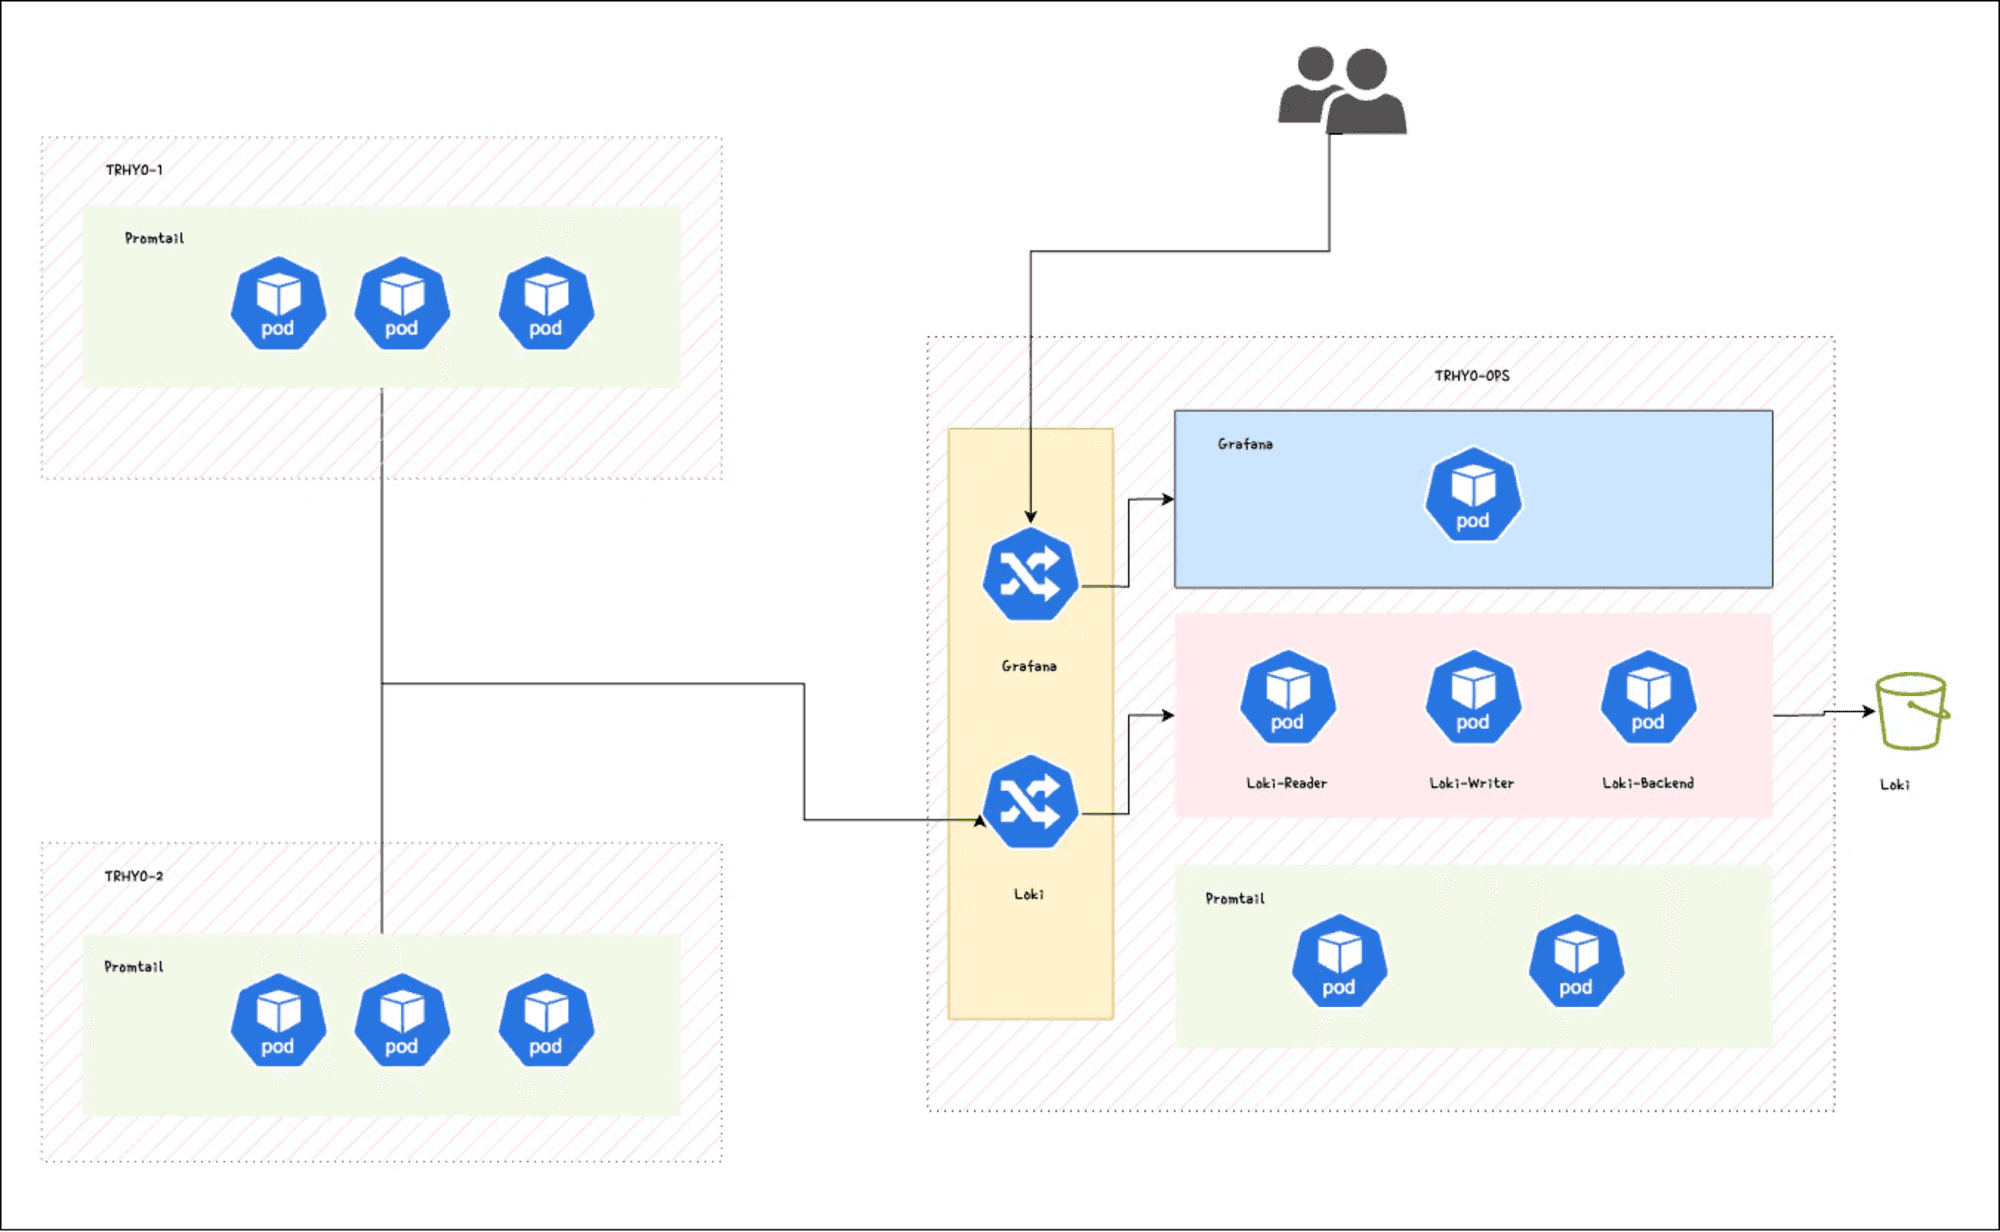
Our architecture revolves around centralizing log collection into the Ops cluster while leveraging Grafana Loki and Promtail for efficient log aggregation and analysis. Here's a breakdown of the key components:
Ops Cluster: Serves as the central hub for log collection and aggregation. Hosts the Grafana Loki deployment, which acts as the storage backend for logs, and the Promtail agent is responsible for collecting and forwarding logs from local. The Ops cluster will host also our Grafana installation.
Remote Clusters (e.g., TRHYO-1, TRHYO-2): Represent the Kubernetes clusters operating in different regions. Promtail agents deployed in these clusters collect logs from local services and forward them to the central Loki instance in the Ops cluster.
Installing Loki
To kickstart our observability journey, we begin by installing Loki in our Ops cluster using the official Helm chart.
First, let's add the Grafana Helm repository:
$ helm repo add grafana https://grafana.github.io/helm-charts
"grafana" has been added to your repositories
$ helm repo update
Hang tight while we grab the latest from your chart repositories...
...Successfully got an update from the "grafana"
Loki offers different installation modes, but for our setup, we'll opt for the simple scalable mode. This mode divides the deployment into three components: writer, read, and backend.
The Helm chart provides extensive configuration options. For this demonstration, we'll keep it simple. However, if you need more details, consult the Loki repository documentation.
Let's create a values file for Loki:
loki:
  auth_enabled: false
  storage:
    bucketNames:
      chunks: loki-chunks
    type: gcs
write:
  replicas: 3
read:
  replicas: 3
backend:
  replicas: 3

serviceAccount:
  create: true
  name: loki
  annotatate:
    ##
    # With this annotation, we can map a GCP Identity with our K8S service account.l
    iam.gke.io/gcp-service-account: [email protected]

ingress:
  enabled: true
  hosts: ['loki.trhyo.com']
##
# Disable non-used objects
gateway:
  enabled: false
test:
  enabled: false
monitoring:
  dashboards:
    enabled: false
  rules:
    enabled: false
  serviceMonitor:
    enabled: false
  metricsInstance:
    enabled: false
  selfMonitoring:
    enabled: false
    grafanaAgent:
      installOperator: false
  lokiCanary:
    enabled: false
In this configuration, we'll run three instances of each component. As we're deploying on GKE, we'll use GCS as the storage bucket. To ensure security, we'll employ workload identity for access to the storage bucket.
To expose Loki to the internet for log ingestion from remote clusters, we'll utilize an Ingress object.
With our values file prepared, let's proceed to install Loki in our Ops cluster:
$ helm install loki grafana/loki --create-namespace -n loki --valuesAfter installation, you can verify the deployment:
$ kubectl get po -n loki
NAME                                                  READY   STATUS    RESTARTS   AGE
loki-backend-0                                        2/2     Running   0          30s
loki-backend-1                                        2/2     Running   0          30s
loki-backend-2                                        2/2     Running   0          30s
loki-read-69b4bc898b-cm42q                            1/1     Running   0          30s
loki-read-69b4bc898b-sbsmj                            1/1     Running   0          30s
loki-read-69b4bc898b-tfr5l                            1/1     Running   0          30s
loki-write-0                                          1/1     Running   0          30s
loki-write-1                                          1/1     Running   0          30s
loki-write-2                                          1/1     Running   0
Installing Promtail
Before we dive into the installation steps, let's clarify the purpose of Promtail and its role in the log collection process.
Promtail serves as the agent responsible for shipping logs to our Loki instances. Highly configurable, Promtail offers various capabilities such as log formatting, content dropping, and relabeling. In this demo, we'll utilize Promtail to collect logs from multiple clusters, including the Ops cluster, and clusters labeled as EUR-1 and EUR-2.
Now, let's prepare the values files for configuring Promtail to collect logs from the respective clusters. When configuring for remote clusters, we'll utilize the external endpoint of our Ingress. For logs from the Ops cluster, we'll utilize the internal service endpoint.
Configuration for Clusters TRHYO-1 and TRHYO-2:
tolerations:
  - operator: Exists
config:
  clients:
    - url: https://loki.trhyo.com/loki/api/v1/push
      external_labels:
        cluster
tolerations:
  - operator: Exists
config:
  clients:
    - url: https://loki.trhyo.com/loki/api/v1/push
      external_labels:
        cluster
Configuration for Cluster TRHYO-OPS
tolerations:
  - operator: Exists
config:
  clients:
    - url: http://loki-write.loki.svc.cluster.local:3100/loki/api/v1/push
      external_labels:
        cluster
With the values files prepared, we can proceed to install Promtail using Helm. Let's begin with the Ops cluster:
$ helm install promtail grafana/promtail --kube-context trhyo-ops --create-namespace -n promtail --valuesAfter installation, you can verify the deployment using the following command:
$ kubectl get po -nEnsure that all Promtail pods are running across the different nodes before proceeding with further configurations.
Visualizing Logs with Grafana
Grafana serves as a powerful visualization and monitoring tool commonly used in observability stacks. It allows users to create rich, interactive dashboards to visualize data from various sources, including logs, metrics, and traces. In our setup, Grafana will play a crucial role in visualizing logs collected by Loki and displayed in a user-friendly manner.
Now, let's proceed with the installation steps. If you don't have Grafana installed in your cluster, you can deploy one for this demo using the following command:
$ helm install grafana grafana/grafana -n grafana --create-namespace --set adminPasswordAfter installing Grafana, the next step is to add Loki as a data source. Navigate to "Home > Configuration > Data sources" in the Grafana UI, and click "Add new data source."

Since Grafana is running in the same cluster as Loki, we can use the internal endpoint to configure it. Simply add the endpoint and a friendly name for the data source.
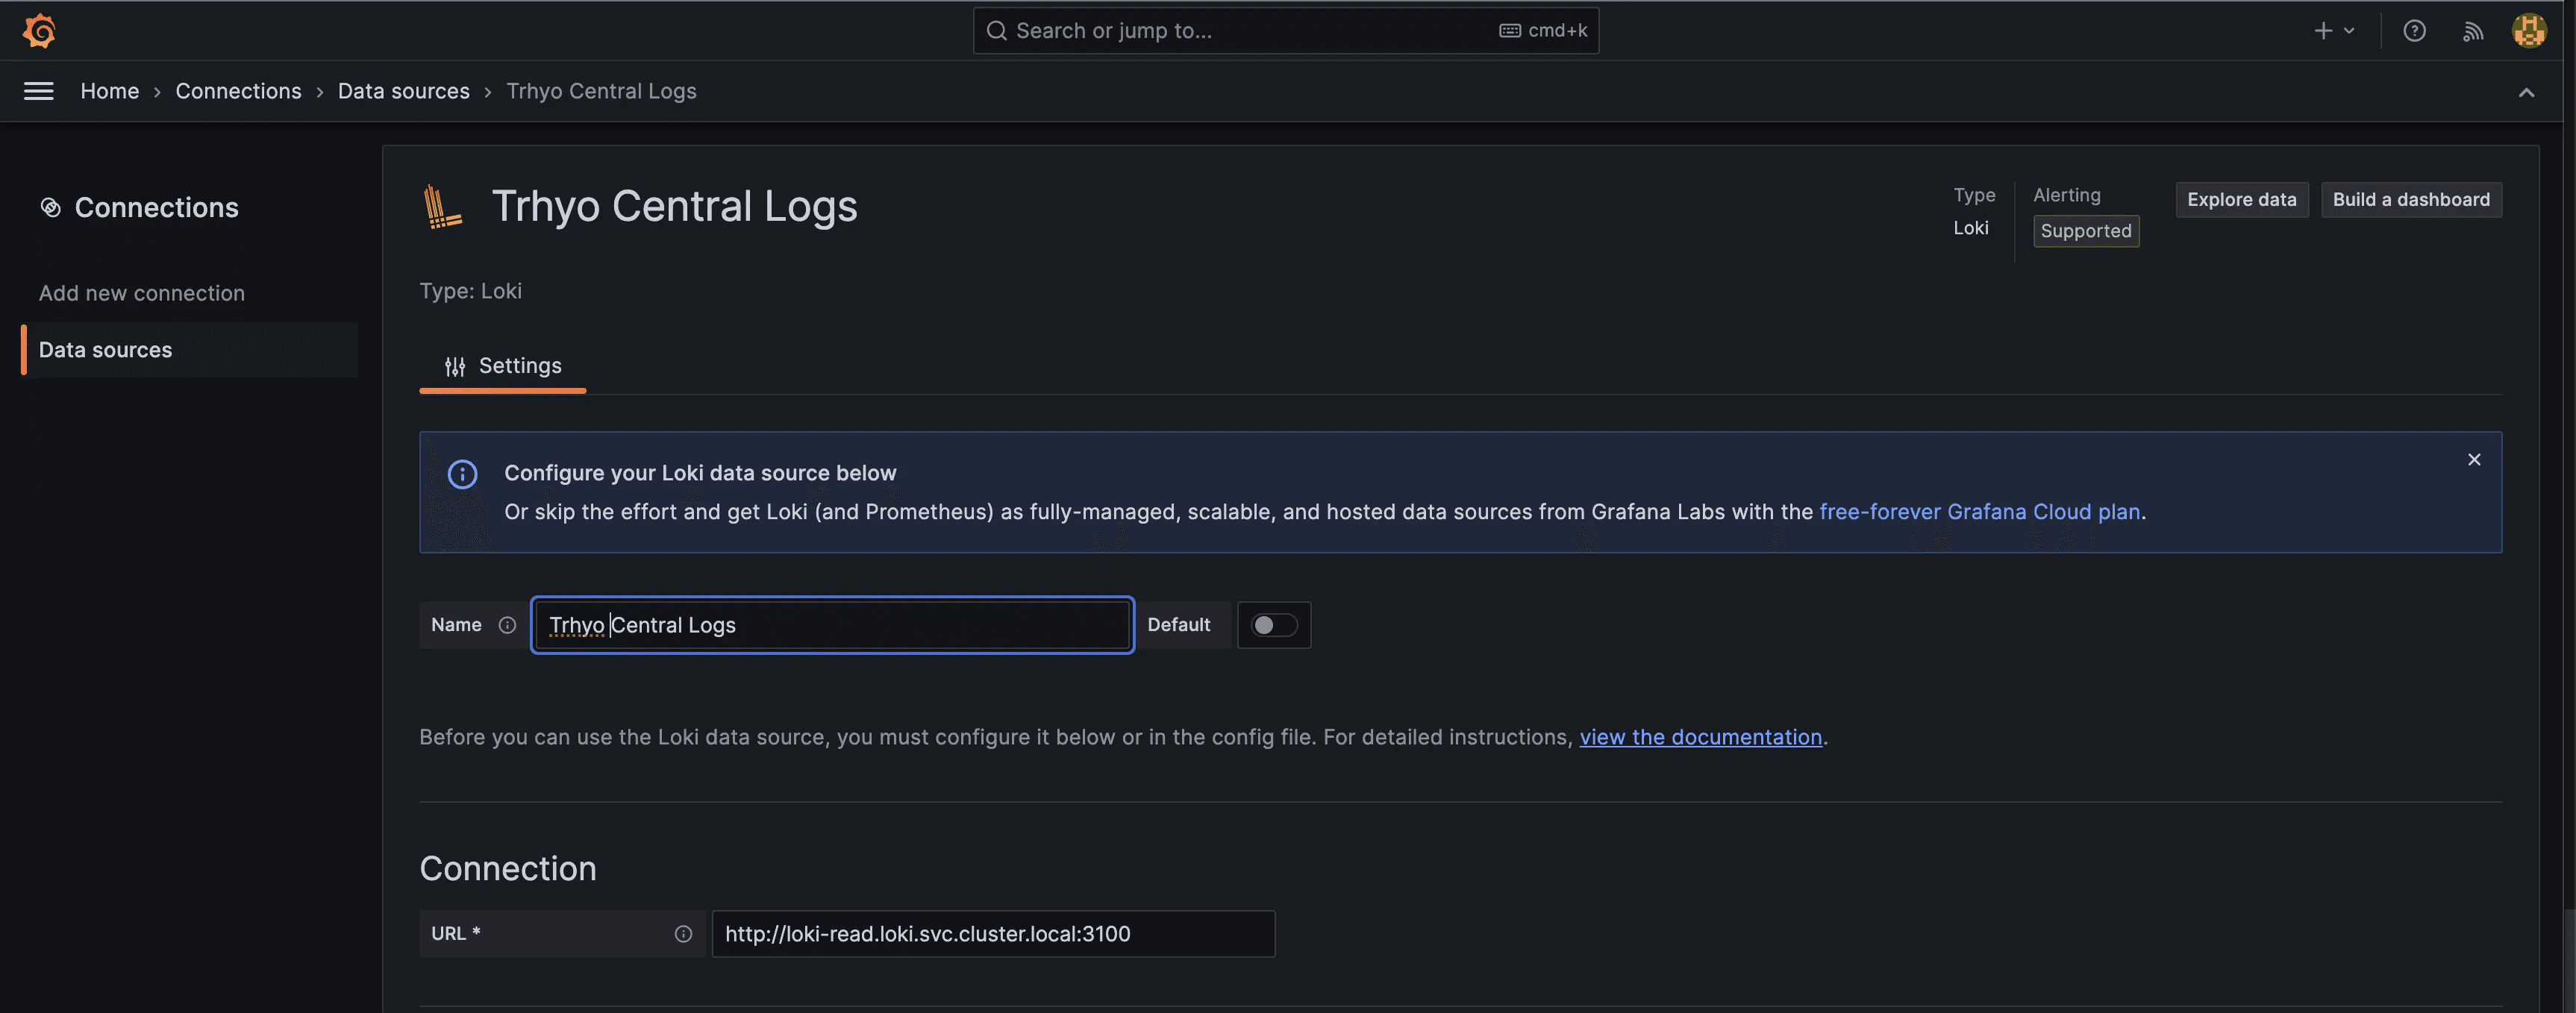
With the data source configured, we can now explore and search for logs within Grafana.
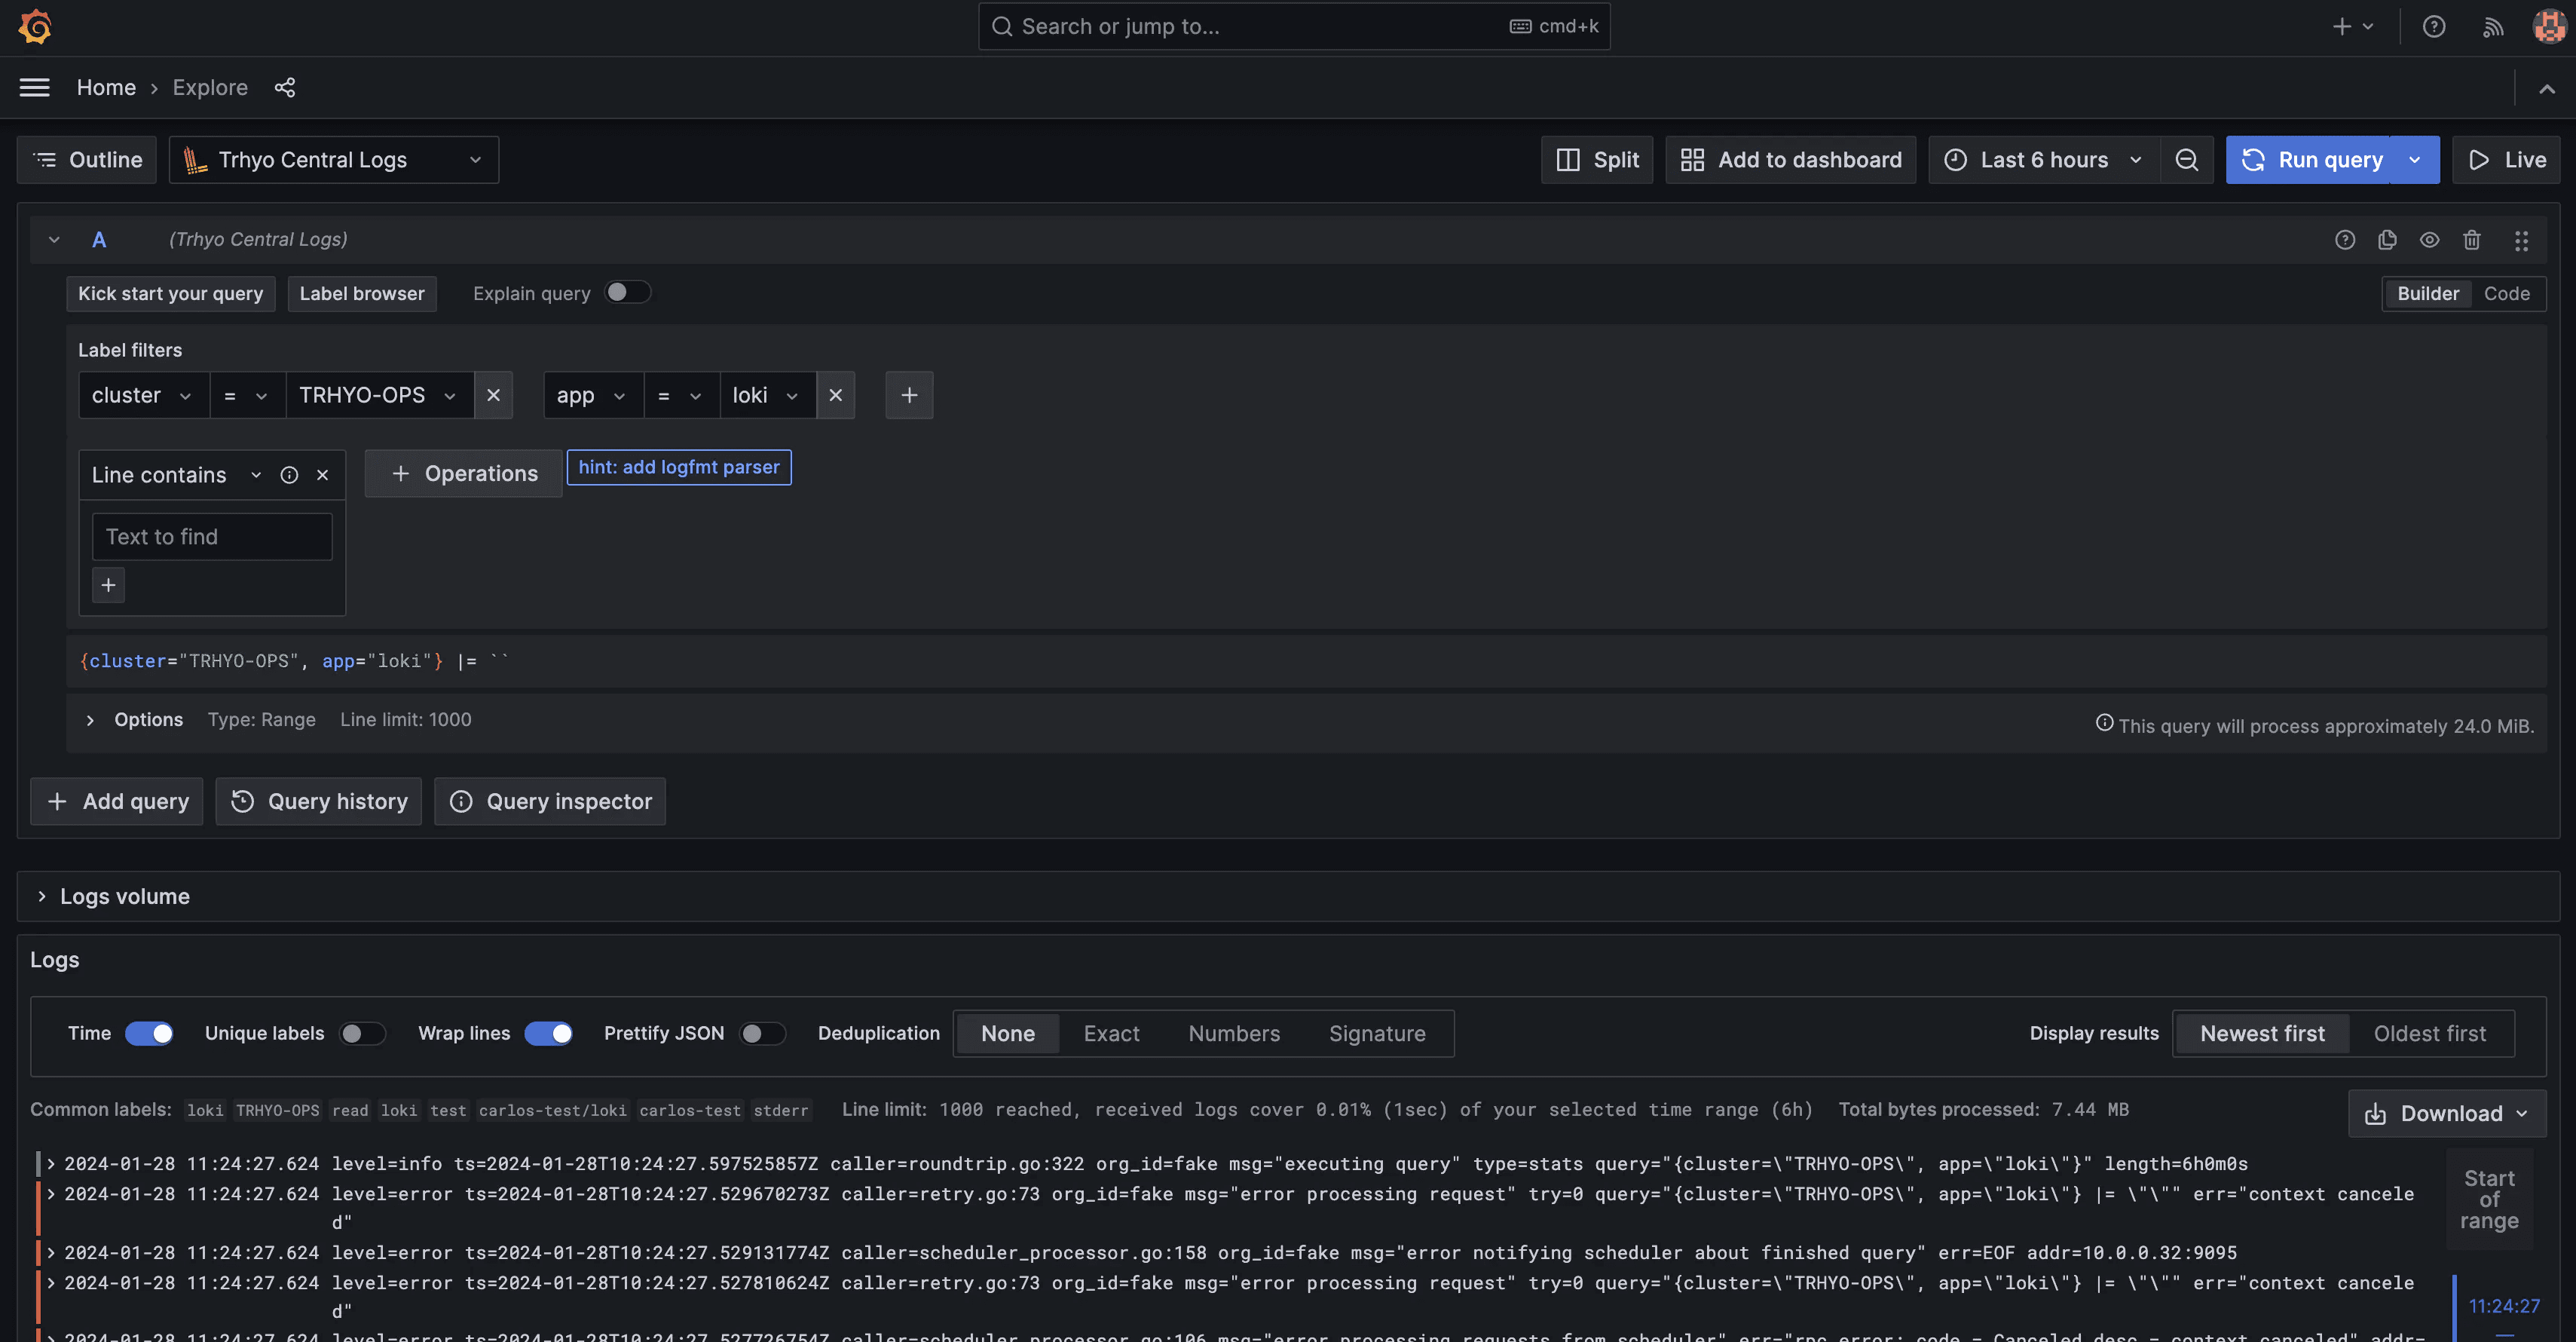
As shown in the images above, logs from the Ops cluster are readily available for querying in Grafana. Additionally, external labels added as part of the Promtail configuration enable efficient querying by source. For further customization, consider adding extra metadata using Pipelines Stages
Adding Remote Clusters
As we near the final steps of our setup, it's crucial to integrate our remote clusters to ensure a comprehensive log collection across our entire system.
We'll begin by shipping logs from our remote clusters into our central Loki location. Utilizing Helm, we can seamlessly deploy Promtail agents to each remote cluster and configure them to send logs to Loki.
$ helm install promtail grafana/promtail --kube-context trhyo-1 --create-namespace -n promtail --values promtail-thryo-1.yaml
$ helm install promtail grafana/promtail --kube-context trhyo-2 --create-namespace -n promtail --values
Following these installations, our Promtail agents will automatically start sending logs to Loki. Now, let's verify this integration by checking Grafana and ensuring that all logs, including those from remote clusters, are visible.

With this step completed, our observability setup becomes more robust, providing a unified view of logs across all clusters and enhancing our troubleshooting capabilities.
Conclusion
In conclusion, navigating the complexities of building an observability platform, especially in the realm of multi-cluster deployments, can be daunting. However, with the powerful combination of Loki and Grafana, the challenges become more manageable.
Loki offers a robust and straightforward solution for log storage, while Grafana provides a comprehensive visualization platform. Together, they form a formidable duo for your observability stack, offering efficient log storage and intuitive visualization capabilities across multiple clusters.
While this demo provides a solid foundation, it's important to note that further adjustments may be necessary depending on your specific ingestion volume and requirements. Loki's feature-rich environment, including multi-tenancy, compaction, retention policies, and caching, allows for tailored configurations to suit your needs.
At Trhyo, we have extensive experience with Loki and have successfully implemented it in various projects. Whether you're encountering issues with your current setup or seeking to enhance your observability stack, we're here to assist you. Feel free to reach out to our team for further guidance and support. Together, let's optimize your observability journey.
Introduction
In today's complex IT landscape, where distributed systems are the norm, achieving observability is paramount for ensuring smooth operations and optimal performance. At Trhyo, we understand the challenges faced by organizations managing multi-cluster solutions, where disparate Kubernetes clusters operate across different regions, each hosting a variety of services and applications.
Observability, the ability to understand and troubleshoot system behavior through logs, metrics, and traces, becomes increasingly complex as the deployment environment grows. It's crucial to have a centralized platform that provides unified visibility across all clusters, facilitating seamless data analysis and troubleshooting.
Throughout this series of blog posts, we'll explore the intricacies of building a robust observability solution tailored for multi-cluster Kubernetes environments. Our journey begins with a focus on log collection, leveraging the power of Grafana Loki and Promtail to centralize and streamline log management across distributed clusters.
Why Grafana Loki?
Grafana Loki is a horizontally-scalable, highly-available, multi-tenant log aggregation system inspired by Prometheus. It is designed to handle high volumes of logs while keeping operational overhead low. At its core, Loki stores logs as chunks of data in object storage, making it highly efficient and cost-effective.
On the other hand, Promtail is an agent that ships logs from applications to Loki. It tailors logs for Loki ingestion, making them ready for querying and analysis.
Loki can be deployed as a single binary for simple setups, scaled for larger deployments, or deployed as microservices for more complex environments. This flexibility enables organizations to tailor Loki's deployment to their specific needs and infrastructure preferences.

Architecture
In our multi-cluster environment, we envision a scenario where distinct Kubernetes clusters operate across different regions. Each cluster hosts a unique set of services and applications, contributing to the complexity of our distributed system. To achieve a unified view of system behavior and facilitate effective troubleshooting, we adopt a centralized approach to log collection.
Centralizing logs into the Ops cluster offers several benefits:
Unified Visibility: Consolidating logs from all clusters into one location provides a comprehensive view of system-wide activities, simplifying monitoring and analysis.
Simplified Troubleshooting: Teams can focus on a single, consolidated log repository in the Ops cluster, streamlining troubleshooting efforts and reducing mean time to resolution (MTTR).
Cross-Cluster Analysis: Centralized logs facilitate cross-cluster analysis, allowing teams to correlate events and detect issues spanning multiple clusters.
Scalability and Manageability: Managing log collection and storage becomes more manageable when centralized, enhancing scalability and reducing operational overhead.
Architectural Overview
Our architecture revolves around centralizing log collection into the Ops cluster while leveraging Grafana Loki and Promtail for efficient log aggregation and analysis. Here's a breakdown of the key components:
Ops Cluster: Serves as the central hub for log collection and aggregation. Hosts the Grafana Loki deployment, which acts as the storage backend for logs, and the Promtail agent is responsible for collecting and forwarding logs from local. The Ops cluster will host also our Grafana installation.
Remote Clusters (e.g., TRHYO-1, TRHYO-2): Represent the Kubernetes clusters operating in different regions. Promtail agents deployed in these clusters collect logs from local services and forward them to the central Loki instance in the Ops cluster.

Installing Loki
To kickstart our observability journey, we begin by installing Loki in our Ops cluster using the official Helm chart.
First, let's add the Grafana Helm repository:
$ helm repo add grafana https://grafana.github.io/helm-charts
"grafana" has been added to your repositories
$ helm repo update
Hang tight while we grab the latest from your chart repositories...
...Successfully got an update from the "grafana"
Loki offers different installation modes, but for our setup, we'll opt for the simple scalable mode. This mode divides the deployment into three components: writer, read, and backend.
The Helm chart provides extensive configuration options. For this demonstration, we'll keep it simple. However, if you need more details, consult the Loki repository documentation.
Let's create a values file for Loki:
loki:
  auth_enabled: false
  storage:
    bucketNames:
      chunks: loki-chunks
    type: gcs
write:
  replicas: 3
read:
  replicas: 3
backend:
  replicas: 3

serviceAccount:
  create: true
  name: loki
  annotatate:
    ##
    # With this annotation, we can map a GCP Identity with our K8S service account.l
    iam.gke.io/gcp-service-account: [email protected]

ingress:
  enabled: true
  hosts: ['loki.trhyo.com']
##
# Disable non-used objects
gateway:
  enabled: false
test:
  enabled: false
monitoring:
  dashboards:
    enabled: false
  rules:
    enabled: false
  serviceMonitor:
    enabled: false
  metricsInstance:
    enabled: false
  selfMonitoring:
    enabled: false
    grafanaAgent:
      installOperator: false
  lokiCanary:
    enabled: false
In this configuration, we'll run three instances of each component. As we're deploying on GKE, we'll use GCS as the storage bucket. To ensure security, we'll employ workload identity for access to the storage bucket.
To expose Loki to the internet for log ingestion from remote clusters, we'll utilize an Ingress object.
With our values file prepared, let's proceed to install Loki in our Ops cluster:
$ helm install loki grafana/loki --create-namespace -n loki --valuesAfter installation, you can verify the deployment:
$ kubectl get po -n loki
NAME                                                  READY   STATUS    RESTARTS   AGE
loki-backend-0                                        2/2     Running   0          30s
loki-backend-1                                        2/2     Running   0          30s
loki-backend-2                                        2/2     Running   0          30s
loki-read-69b4bc898b-cm42q                            1/1     Running   0          30s
loki-read-69b4bc898b-sbsmj                            1/1     Running   0          30s
loki-read-69b4bc898b-tfr5l                            1/1     Running   0          30s
loki-write-0                                          1/1     Running   0          30s
loki-write-1                                          1/1     Running   0          30s
loki-write-2                                          1/1     Running   0
Installing Promtail
Before we dive into the installation steps, let's clarify the purpose of Promtail and its role in the log collection process.
Promtail serves as the agent responsible for shipping logs to our Loki instances. Highly configurable, Promtail offers various capabilities such as log formatting, content dropping, and relabeling. In this demo, we'll utilize Promtail to collect logs from multiple clusters, including the Ops cluster, and clusters labeled as EUR-1 and EUR-2.
Now, let's prepare the values files for configuring Promtail to collect logs from the respective clusters. When configuring for remote clusters, we'll utilize the external endpoint of our Ingress. For logs from the Ops cluster, we'll utilize the internal service endpoint.
Configuration for Clusters TRHYO-1 and TRHYO-2:
tolerations:
  - operator: Exists
config:
  clients:
    - url: https://loki.trhyo.com/loki/api/v1/push
      external_labels:
        cluster
tolerations:
  - operator: Exists
config:
  clients:
    - url: https://loki.trhyo.com/loki/api/v1/push
      external_labels:
        cluster
Configuration for Cluster TRHYO-OPS
tolerations:
  - operator: Exists
config:
  clients:
    - url: http://loki-write.loki.svc.cluster.local:3100/loki/api/v1/push
      external_labels:
        cluster
With the values files prepared, we can proceed to install Promtail using Helm. Let's begin with the Ops cluster:
$ helm install promtail grafana/promtail --kube-context trhyo-ops --create-namespace -n promtail --valuesAfter installation, you can verify the deployment using the following command:
$ kubectl get po -nEnsure that all Promtail pods are running across the different nodes before proceeding with further configurations.
Visualizing Logs with Grafana
Grafana serves as a powerful visualization and monitoring tool commonly used in observability stacks. It allows users to create rich, interactive dashboards to visualize data from various sources, including logs, metrics, and traces. In our setup, Grafana will play a crucial role in visualizing logs collected by Loki and displayed in a user-friendly manner.
Now, let's proceed with the installation steps. If you don't have Grafana installed in your cluster, you can deploy one for this demo using the following command:
$ helm install grafana grafana/grafana -n grafana --create-namespace --set adminPasswordAfter installing Grafana, the next step is to add Loki as a data source. Navigate to "Home > Configuration > Data sources" in the Grafana UI, and click "Add new data source."

Since Grafana is running in the same cluster as Loki, we can use the internal endpoint to configure it. Simply add the endpoint and a friendly name for the data source.

With the data source configured, we can now explore and search for logs within Grafana.

As shown in the images above, logs from the Ops cluster are readily available for querying in Grafana. Additionally, external labels added as part of the Promtail configuration enable efficient querying by source. For further customization, consider adding extra metadata using Pipelines Stages
Adding Remote Clusters
As we near the final steps of our setup, it's crucial to integrate our remote clusters to ensure a comprehensive log collection across our entire system.
We'll begin by shipping logs from our remote clusters into our central Loki location. Utilizing Helm, we can seamlessly deploy Promtail agents to each remote cluster and configure them to send logs to Loki.
$ helm install promtail grafana/promtail --kube-context trhyo-1 --create-namespace -n promtail --values promtail-thryo-1.yaml
$ helm install promtail grafana/promtail --kube-context trhyo-2 --create-namespace -n promtail --values
Following these installations, our Promtail agents will automatically start sending logs to Loki. Now, let's verify this integration by checking Grafana and ensuring that all logs, including those from remote clusters, are visible.

With this step completed, our observability setup becomes more robust, providing a unified view of logs across all clusters and enhancing our troubleshooting capabilities.
Conclusion
In conclusion, navigating the complexities of building an observability platform, especially in the realm of multi-cluster deployments, can be daunting. However, with the powerful combination of Loki and Grafana, the challenges become more manageable.
Loki offers a robust and straightforward solution for log storage, while Grafana provides a comprehensive visualization platform. Together, they form a formidable duo for your observability stack, offering efficient log storage and intuitive visualization capabilities across multiple clusters.
While this demo provides a solid foundation, it's important to note that further adjustments may be necessary depending on your specific ingestion volume and requirements. Loki's feature-rich environment, including multi-tenancy, compaction, retention policies, and caching, allows for tailored configurations to suit your needs.
At Trhyo, we have extensive experience with Loki and have successfully implemented it in various projects. Whether you're encountering issues with your current setup or seeking to enhance your observability stack, we're here to assist you. Feel free to reach out to our team for further guidance and support. Together, let's optimize your observability journey.
Introduction
In today's complex IT landscape, where distributed systems are the norm, achieving observability is paramount for ensuring smooth operations and optimal performance. At Trhyo, we understand the challenges faced by organizations managing multi-cluster solutions, where disparate Kubernetes clusters operate across different regions, each hosting a variety of services and applications.
Observability, the ability to understand and troubleshoot system behavior through logs, metrics, and traces, becomes increasingly complex as the deployment environment grows. It's crucial to have a centralized platform that provides unified visibility across all clusters, facilitating seamless data analysis and troubleshooting.
Throughout this series of blog posts, we'll explore the intricacies of building a robust observability solution tailored for multi-cluster Kubernetes environments. Our journey begins with a focus on log collection, leveraging the power of Grafana Loki and Promtail to centralize and streamline log management across distributed clusters.
Why Grafana Loki?
Grafana Loki is a horizontally-scalable, highly-available, multi-tenant log aggregation system inspired by Prometheus. It is designed to handle high volumes of logs while keeping operational overhead low. At its core, Loki stores logs as chunks of data in object storage, making it highly efficient and cost-effective.
On the other hand, Promtail is an agent that ships logs from applications to Loki. It tailors logs for Loki ingestion, making them ready for querying and analysis.
Loki can be deployed as a single binary for simple setups, scaled for larger deployments, or deployed as microservices for more complex environments. This flexibility enables organizations to tailor Loki's deployment to their specific needs and infrastructure preferences.

Architecture
In our multi-cluster environment, we envision a scenario where distinct Kubernetes clusters operate across different regions. Each cluster hosts a unique set of services and applications, contributing to the complexity of our distributed system. To achieve a unified view of system behavior and facilitate effective troubleshooting, we adopt a centralized approach to log collection.
Centralizing logs into the Ops cluster offers several benefits:
Unified Visibility: Consolidating logs from all clusters into one location provides a comprehensive view of system-wide activities, simplifying monitoring and analysis.
Simplified Troubleshooting: Teams can focus on a single, consolidated log repository in the Ops cluster, streamlining troubleshooting efforts and reducing mean time to resolution (MTTR).
Cross-Cluster Analysis: Centralized logs facilitate cross-cluster analysis, allowing teams to correlate events and detect issues spanning multiple clusters.
Scalability and Manageability: Managing log collection and storage becomes more manageable when centralized, enhancing scalability and reducing operational overhead.
Architectural Overview
Our architecture revolves around centralizing log collection into the Ops cluster while leveraging Grafana Loki and Promtail for efficient log aggregation and analysis. Here's a breakdown of the key components:
Ops Cluster: Serves as the central hub for log collection and aggregation. Hosts the Grafana Loki deployment, which acts as the storage backend for logs, and the Promtail agent is responsible for collecting and forwarding logs from local. The Ops cluster will host also our Grafana installation.
Remote Clusters (e.g., TRHYO-1, TRHYO-2): Represent the Kubernetes clusters operating in different regions. Promtail agents deployed in these clusters collect logs from local services and forward them to the central Loki instance in the Ops cluster.

Installing Loki
To kickstart our observability journey, we begin by installing Loki in our Ops cluster using the official Helm chart.
First, let's add the Grafana Helm repository:
$ helm repo add grafana https://grafana.github.io/helm-charts
"grafana" has been added to your repositories
$ helm repo update
Hang tight while we grab the latest from your chart repositories...
...Successfully got an update from the "grafana"
Loki offers different installation modes, but for our setup, we'll opt for the simple scalable mode. This mode divides the deployment into three components: writer, read, and backend.
The Helm chart provides extensive configuration options. For this demonstration, we'll keep it simple. However, if you need more details, consult the Loki repository documentation.
Let's create a values file for Loki:
loki:
  auth_enabled: false
  storage:
    bucketNames:
      chunks: loki-chunks
    type: gcs
write:
  replicas: 3
read:
  replicas: 3
backend:
  replicas: 3

serviceAccount:
  create: true
  name: loki
  annotatate:
    ##
    # With this annotation, we can map a GCP Identity with our K8S service account.l
    iam.gke.io/gcp-service-account: [email protected]

ingress:
  enabled: true
  hosts: ['loki.trhyo.com']
##
# Disable non-used objects
gateway:
  enabled: false
test:
  enabled: false
monitoring:
  dashboards:
    enabled: false
  rules:
    enabled: false
  serviceMonitor:
    enabled: false
  metricsInstance:
    enabled: false
  selfMonitoring:
    enabled: false
    grafanaAgent:
      installOperator: false
  lokiCanary:
    enabled: false
In this configuration, we'll run three instances of each component. As we're deploying on GKE, we'll use GCS as the storage bucket. To ensure security, we'll employ workload identity for access to the storage bucket.
To expose Loki to the internet for log ingestion from remote clusters, we'll utilize an Ingress object.
With our values file prepared, let's proceed to install Loki in our Ops cluster:
$ helm install loki grafana/loki --create-namespace -n loki --valuesAfter installation, you can verify the deployment:
$ kubectl get po -n loki
NAME                                                  READY   STATUS    RESTARTS   AGE
loki-backend-0                                        2/2     Running   0          30s
loki-backend-1                                        2/2     Running   0          30s
loki-backend-2                                        2/2     Running   0          30s
loki-read-69b4bc898b-cm42q                            1/1     Running   0          30s
loki-read-69b4bc898b-sbsmj                            1/1     Running   0          30s
loki-read-69b4bc898b-tfr5l                            1/1     Running   0          30s
loki-write-0                                          1/1     Running   0          30s
loki-write-1                                          1/1     Running   0          30s
loki-write-2                                          1/1     Running   0
Installing Promtail
Before we dive into the installation steps, let's clarify the purpose of Promtail and its role in the log collection process.
Promtail serves as the agent responsible for shipping logs to our Loki instances. Highly configurable, Promtail offers various capabilities such as log formatting, content dropping, and relabeling. In this demo, we'll utilize Promtail to collect logs from multiple clusters, including the Ops cluster, and clusters labeled as EUR-1 and EUR-2.
Now, let's prepare the values files for configuring Promtail to collect logs from the respective clusters. When configuring for remote clusters, we'll utilize the external endpoint of our Ingress. For logs from the Ops cluster, we'll utilize the internal service endpoint.
Configuration for Clusters TRHYO-1 and TRHYO-2:
tolerations:
  - operator: Exists
config:
  clients:
    - url: https://loki.trhyo.com/loki/api/v1/push
      external_labels:
        cluster
tolerations:
  - operator: Exists
config:
  clients:
    - url: https://loki.trhyo.com/loki/api/v1/push
      external_labels:
        cluster
Configuration for Cluster TRHYO-OPS
tolerations:
  - operator: Exists
config:
  clients:
    - url: http://loki-write.loki.svc.cluster.local:3100/loki/api/v1/push
      external_labels:
        cluster
With the values files prepared, we can proceed to install Promtail using Helm. Let's begin with the Ops cluster:
$ helm install promtail grafana/promtail --kube-context trhyo-ops --create-namespace -n promtail --valuesAfter installation, you can verify the deployment using the following command:
$ kubectl get po -nEnsure that all Promtail pods are running across the different nodes before proceeding with further configurations.
Visualizing Logs with Grafana
Grafana serves as a powerful visualization and monitoring tool commonly used in observability stacks. It allows users to create rich, interactive dashboards to visualize data from various sources, including logs, metrics, and traces. In our setup, Grafana will play a crucial role in visualizing logs collected by Loki and displayed in a user-friendly manner.
Now, let's proceed with the installation steps. If you don't have Grafana installed in your cluster, you can deploy one for this demo using the following command:
$ helm install grafana grafana/grafana -n grafana --create-namespace --set adminPasswordAfter installing Grafana, the next step is to add Loki as a data source. Navigate to "Home > Configuration > Data sources" in the Grafana UI, and click "Add new data source."

Since Grafana is running in the same cluster as Loki, we can use the internal endpoint to configure it. Simply add the endpoint and a friendly name for the data source.

With the data source configured, we can now explore and search for logs within Grafana.

As shown in the images above, logs from the Ops cluster are readily available for querying in Grafana. Additionally, external labels added as part of the Promtail configuration enable efficient querying by source. For further customization, consider adding extra metadata using Pipelines Stages
Adding Remote Clusters
As we near the final steps of our setup, it's crucial to integrate our remote clusters to ensure a comprehensive log collection across our entire system.
We'll begin by shipping logs from our remote clusters into our central Loki location. Utilizing Helm, we can seamlessly deploy Promtail agents to each remote cluster and configure them to send logs to Loki.
$ helm install promtail grafana/promtail --kube-context trhyo-1 --create-namespace -n promtail --values promtail-thryo-1.yaml
$ helm install promtail grafana/promtail --kube-context trhyo-2 --create-namespace -n promtail --values
Following these installations, our Promtail agents will automatically start sending logs to Loki. Now, let's verify this integration by checking Grafana and ensuring that all logs, including those from remote clusters, are visible.

With this step completed, our observability setup becomes more robust, providing a unified view of logs across all clusters and enhancing our troubleshooting capabilities.
Conclusion
In conclusion, navigating the complexities of building an observability platform, especially in the realm of multi-cluster deployments, can be daunting. However, with the powerful combination of Loki and Grafana, the challenges become more manageable.
Loki offers a robust and straightforward solution for log storage, while Grafana provides a comprehensive visualization platform. Together, they form a formidable duo for your observability stack, offering efficient log storage and intuitive visualization capabilities across multiple clusters.
While this demo provides a solid foundation, it's important to note that further adjustments may be necessary depending on your specific ingestion volume and requirements. Loki's feature-rich environment, including multi-tenancy, compaction, retention policies, and caching, allows for tailored configurations to suit your needs.
At Trhyo, we have extensive experience with Loki and have successfully implemented it in various projects. Whether you're encountering issues with your current setup or seeking to enhance your observability stack, we're here to assist you. Feel free to reach out to our team for further guidance and support. Together, let's optimize your observability journey.
